Basic Example for Graph Creation and Web Visualisation
Graph Creation using graph Client
# This Example is based on doc:
# Donwload HR example schemas (We need use HR Scheme):
https://github.com/oracle/db-sample-schemas/releases/tag/v19.2
# NOTE: Remember you can use sqdeveloper for oracle graphs. Check this:
# https://medium.com/oracledevs/6db0e56aa822
# Review if the user has this role on the database
GRANT PGX_SESSION_ADD_PUBLISHED_GRAPH to ORAGRAPH ;
# Create chart using opg4j using oragraph user
export JAVA11_HOME=/usr/lib/jvm/jre-11
cd /home/oragraph/oracle-graph-client-23.2.1/bin
opg4j --base_url http://localhost:7007 -u ORAGRAPH
Every command from now it will be executed on opg4j client:
opg4j>
// Create a graph with employees, departments, and "employee works at department",
// by executing a CREATE PROPERTY GRAPH statement.
// The following statement creates a graph in the in-memory graph server (PGX):
String statement =
"CREATE PROPERTY GRAPH hr_simplified "
+ " VERTEX TABLES ( "
+ " hr.employees LABEL employee "
+ " PROPERTIES ARE ALL COLUMNS EXCEPT ( job_id, manager_id, department_id ), "
+ " hr.departments LABEL department "
+ " PROPERTIES ( department_id, department_name ) "
+ " ) "
+ " EDGE TABLES ( "
+ " hr.employees AS works_at "
+ " SOURCE KEY ( employee_id ) REFERENCES employees "
+ " DESTINATION departments "
+ " PROPERTIES ( employee_id ) "
+ " )";
session.executePgql(statement);
// To get a handle to the graph, execute:
PgxGraph g = session.getGraph("HR_SIMPLIFIED");
// Run a few PGQL queries
// You can use this handle to run PGQL queries on this graph.
// For example, to find the department that "Nandita Sarchand" works for, execute:
String query =
"SELECT dep.department_name "
+ "FROM MATCH (emp:Employee) -[:works_at]-> (dep:Department) "
+ "WHERE emp.first_name = 'Nandita' AND emp.last_name = 'Sarchand' "
+ "ORDER BY 1";
PgqlResultSet resultSet = g.queryPgql(query);
resultSet.print();
+-----------------+
| department_name |
+-----------------+
| Shipping |
+-----------------+
// To get an overview of the types of vertices and their frequencies, execute:
String query =
"SELECT label(n), COUNT(*) "
+ "FROM MATCH (n) "
+ "GROUP BY label(n) "
+ "ORDER BY COUNT(*) DESC";
PgqlResultSet resultSet = g.queryPgql(query);
resultSet.print();
+-----------------------+
| label(n) | COUNT(*) |
+-----------------------+
| EMPLOYEE | 107 |
| DEPARTMENT | 27 |
+-----------------------+
// To get an overview of the types of edges and their frequencies, execute:
String query =
"SELECT label(n) AS srcLbl, label(e) AS edgeLbl, label(m) AS dstLbl, COUNT(*) "
+ "FROM MATCH (n) -[e]-> (m) "
+ "GROUP BY srcLbl, edgeLbl, dstLbl "
+ "ORDER BY COUNT(*) DESC";
PgqlResultSet resultSet = g.queryPgql(query);
resultSet.print();
+---------------------------------------------+
| srcLbl | edgeLbl | dstLbl | COUNT(*) |
+---------------------------------------------+
| EMPLOYEE | WORKS_AT | DEPARTMENT | 106 |
+---------------------------------------------+
// Execute algorithms and query the algorithm results
// Now that you have the graph in memory, you can run each built-in
// algorithms using a single API invocation. For example, for pagerank:
analyst.pagerank(g)
// As you can see from the preceding outputs,
// each algorithm created a new vertex property
// on the graph holding the output of the algorithm.
// To print the most important
// people in the graph (according to pagerank),
// you can run the following query
session.queryPgql("select m.FIRST_NAME, m.LAST_NAME, m.pagerank from HR_SIMPLIFIED match (m:EMPLOYEE) where m.FIRST_NAME = 'Nandita' ").print().close()
+---------------------------------------------------+
| m.FIRST_NAME | m.LAST_NAME | m.pagerank |
+---------------------------------------------------+
| Nandita | Sarchand | 0.001119402985074627 |
+---------------------------------------------------+
// In the following example, we order departments by their pagerank value.
// Departments with higher pagerank values have more employees.
session.queryPgql("select m.DEPARTMENT_NAME, m.pagerank from HR_SIMPLIFIED match (m:DEPARTMENT) order by m.pagerank ").print().close();
+----------------------------------------------+
| m.DEPARTMENT_NAME | m.pagerank |
+----------------------------------------------+
| Manufacturing | 0.001119402985074627 |
| Construction | 0.001119402985074627 |
| Contracting | 0.001119402985074627 |
| Operations | 0.001119402985074627 |
| IT Support | 0.001119402985074627 |
| NOC | 0.001119402985074627 |
| IT Helpdesk | 0.001119402985074627 |
| Government Sales | 0.001119402985074627 |
| Retail Sales | 0.001119402985074627 |
| Recruiting | 0.001119402985074627 |
| Payroll | 0.001119402985074627 |
| Treasury | 0.001119402985074627 |
| Corporate Tax | 0.001119402985074627 |
| Control And Credit | 0.001119402985074627 |
| Shareholder Services | 0.001119402985074627 |
| Benefits | 0.001119402985074627 |
| Human Resources | 0.0020708955223880596 |
| Administration | 0.0020708955223880596 |
| Public Relations | 0.0020708955223880596 |
| Marketing | 0.003022388059701493 |
| Accounting | 0.003022388059701493 |
| Executive | 0.003973880597014925 |
| IT | 0.005876865671641792 |
| Purchasing | 0.006828358208955224 |
| Finance | 0.006828358208955224 |
| Sales | 0.03347014925373134 |
| Shipping | 0.043936567164179076 |
+----------------------------------------------+
// Share the Graph with Other Sessions
// After you load the graph into the server,
// you can use the publish() API to make the graph
// visible to other sessions,
// such as the graph visualization #session. For example:
g.publish(VertexProperty.ALL, EdgeProperty.ALL)
// Next time you connect you can access the graph kept on memory without re-loading it,
// if the graph server has not been shutdown or restarted between logins.
// PgxGraph g = session.getGraph("HR_SIMPLIFIED");
// Get sessionid
session
session ==> PgxSession[ID=e5ec617f-28b6-450a-b6f5-eba38242c569,source=pgxShell]
# Visualizate graph using user,pass and pgx id session:
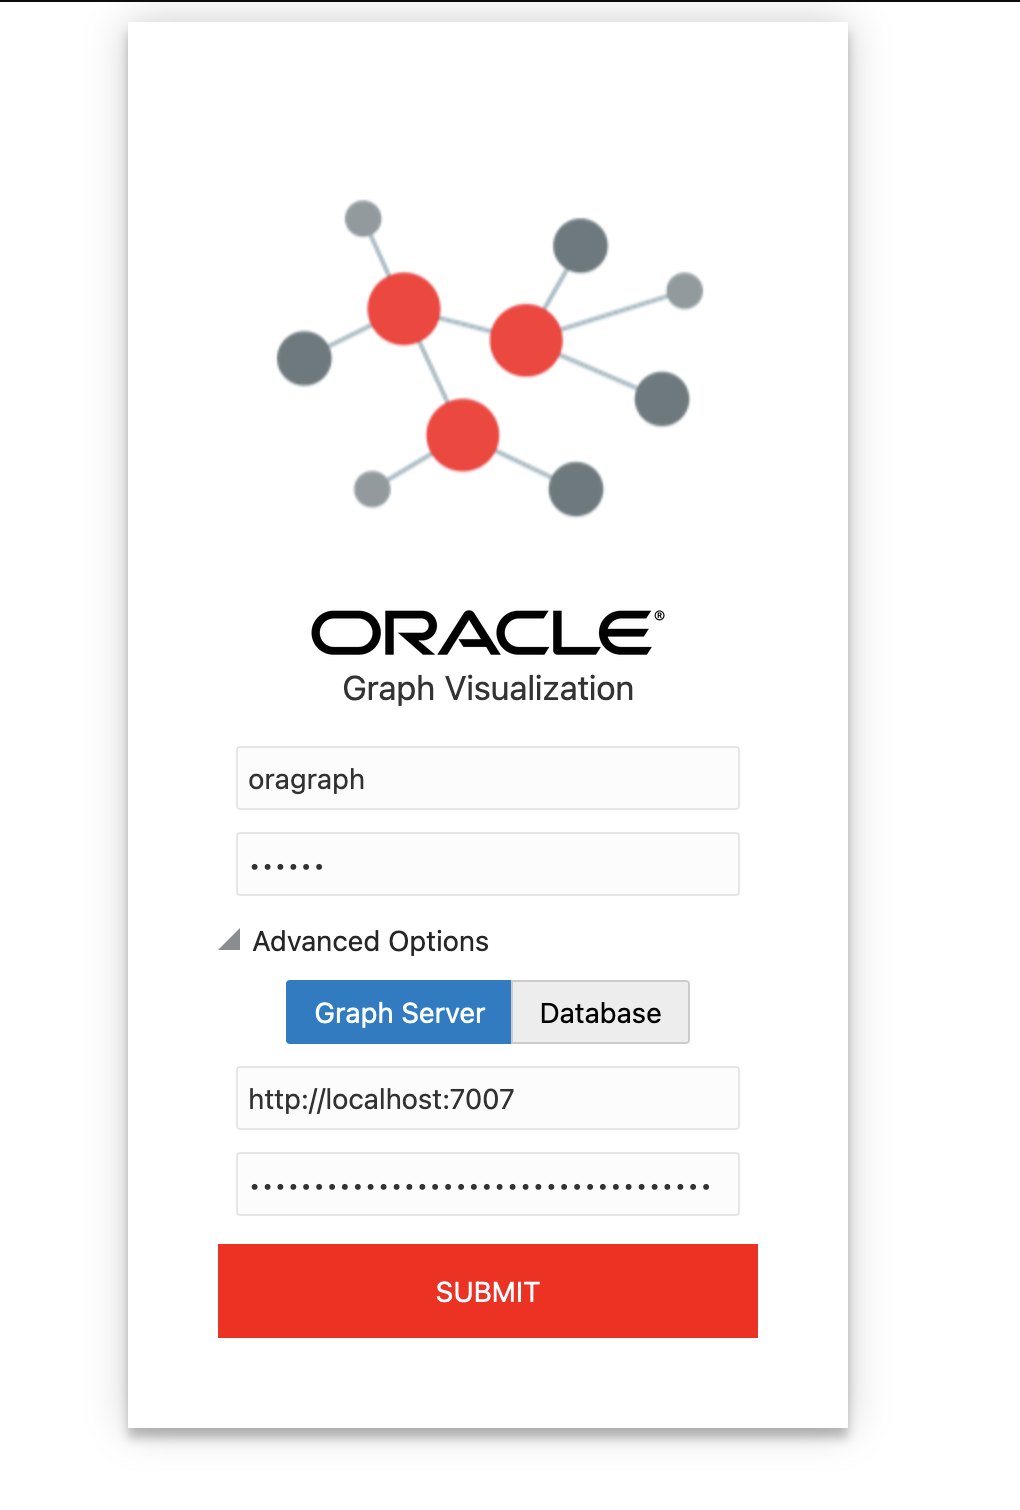
go to http://localhost:7007/ui/ (or http://localhost:9090/graphviz if you are using your tomcat in the other install example)
# Enter values
user:oragraph
pass:oracle
(advanced options)
graph server: http://localhost:7007
pgxid: (enter last value for my example: e5ec617f-28b6-450a-b6f5-eba38242c569 )
# in case of errors review:
tail -f /var/log/oracle/graph/pgx-server.log
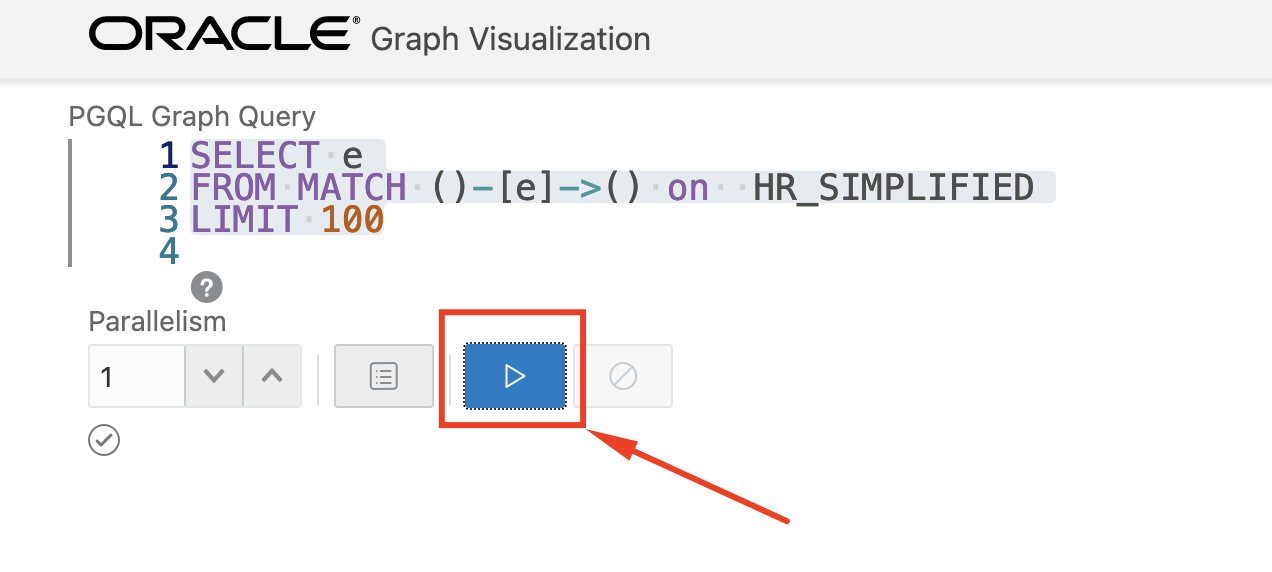
# On the interface http://localhost:7007/ui/ execute this command:
# on the button "list of graphs" beside to "play" button
# you must to select graph "HR_SIMPLIFIED"

# The command for execute is:
SELECT e
FROM MATCH ()-[e]->() on HR_SIMPLIFIED
LIMIT 100
# for execute chart press the "PLAY" button
Now you can see the graph created using graph client but now on the web interface:
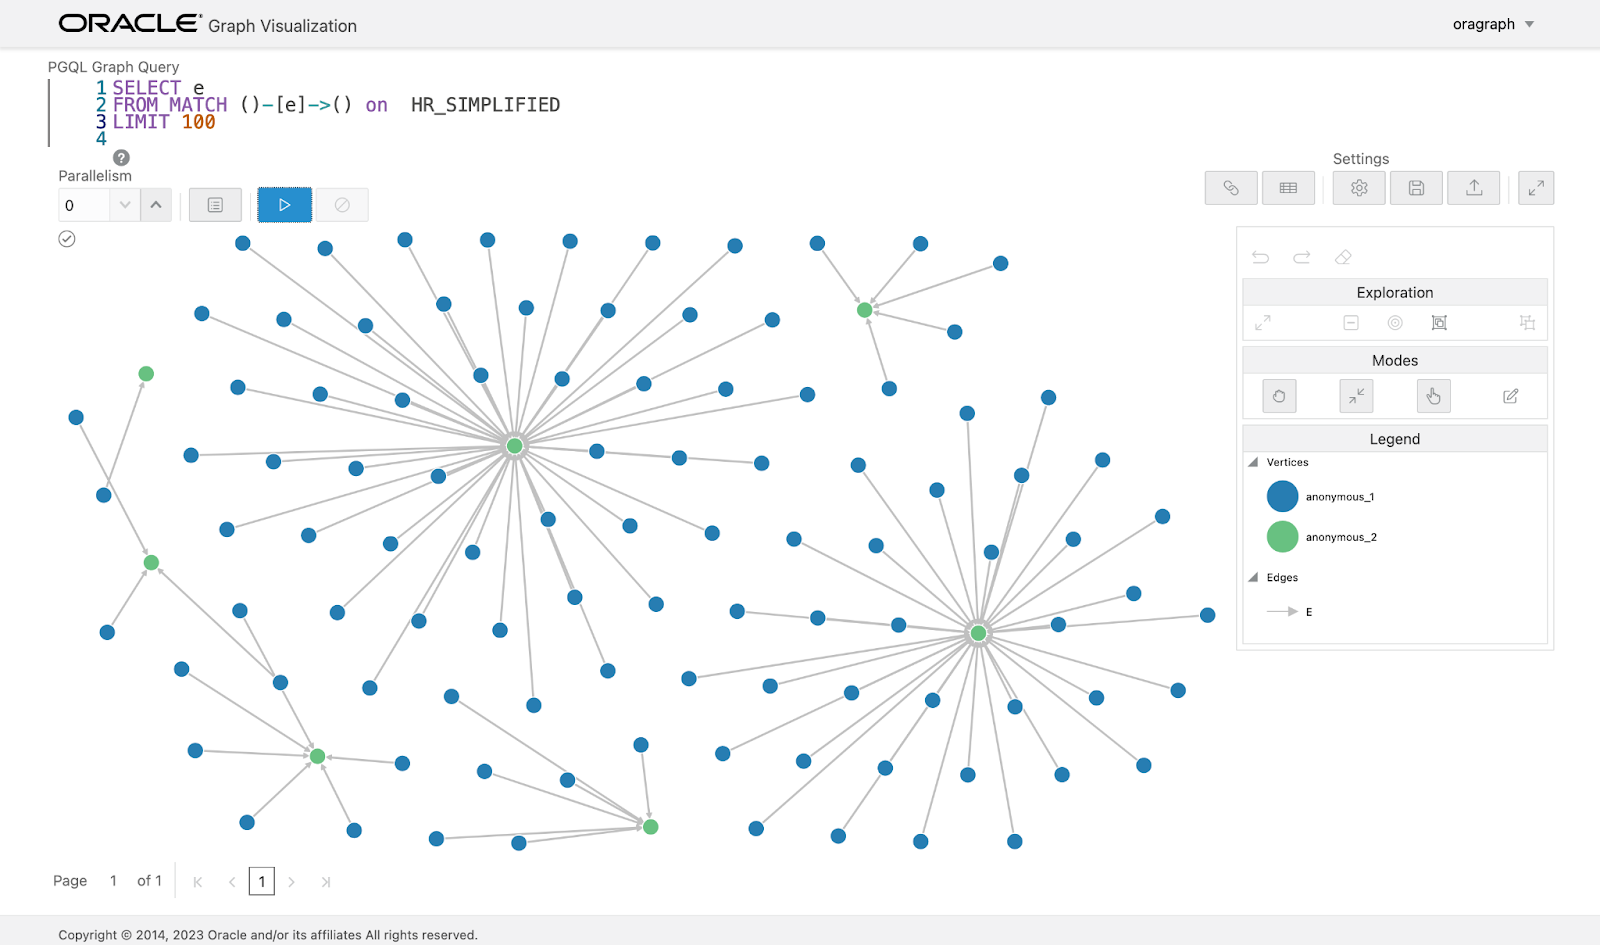
That’s all. I hope this little tutorial could be helpful for you.
Cheers.
Felipe Donoso.